Showing posts with label 2. Short-term Market Musings. Show all posts

Tuesday, September 25, 2012

Short-term Market Musings 09/25

Dynamic regression support circa 1425-30 on the e-mini futures (4-hour chart basis), resistance 1447.  Elder Impulse system went to sell today.  NY McClellan Oscillator -36.  TRIN closed at a whopping 3.1, so distribution was lopsided.  200SMA on the hourly chart is 142.71.

Wednesday trading stats...amazingly consistent the last dozen weeks.
Since and including 6/27 (week after the last quarterly expiration), SPY has closed up 10 out of the last 12 Wednesdays, but only by an average of 0.26...bulk of the cumulative gains of 3.06 came on 3 of those 10 days.  The 2 down days both closed down a tiny -0.12.  So basically it's been a "stuck up" day with strong underlying bid to the market...setting up for weekly expiration I suppose.

8 of the 12 days gapped up, but only 5 (42%) closed above the opening print.  Amazingly, 10 out of the last 11 Wednesdays, the opening gap was faded and reversed during regular trading hours.  In other words, if we gapped up, intraday action would close below the open.  Conversely, if we gapped down, SPY closed above its opening print.  The only day the gap wasn't faded...we closed right at the opening print, so net intraday gains was a big fat 0.  In general, Wednesday trading has seen very low volatility the last 9 weeks with an average gain of 0.07...we'll see if today was a catalyst to change that.

Might be wishful thinking, but I'm hoping for another ~1.5% downside sub 1420 on the futures...lopsided TRIN only read I see right now that might prevent that.

Tuesday, September 4, 2012

Short-term Market Musings 09/03

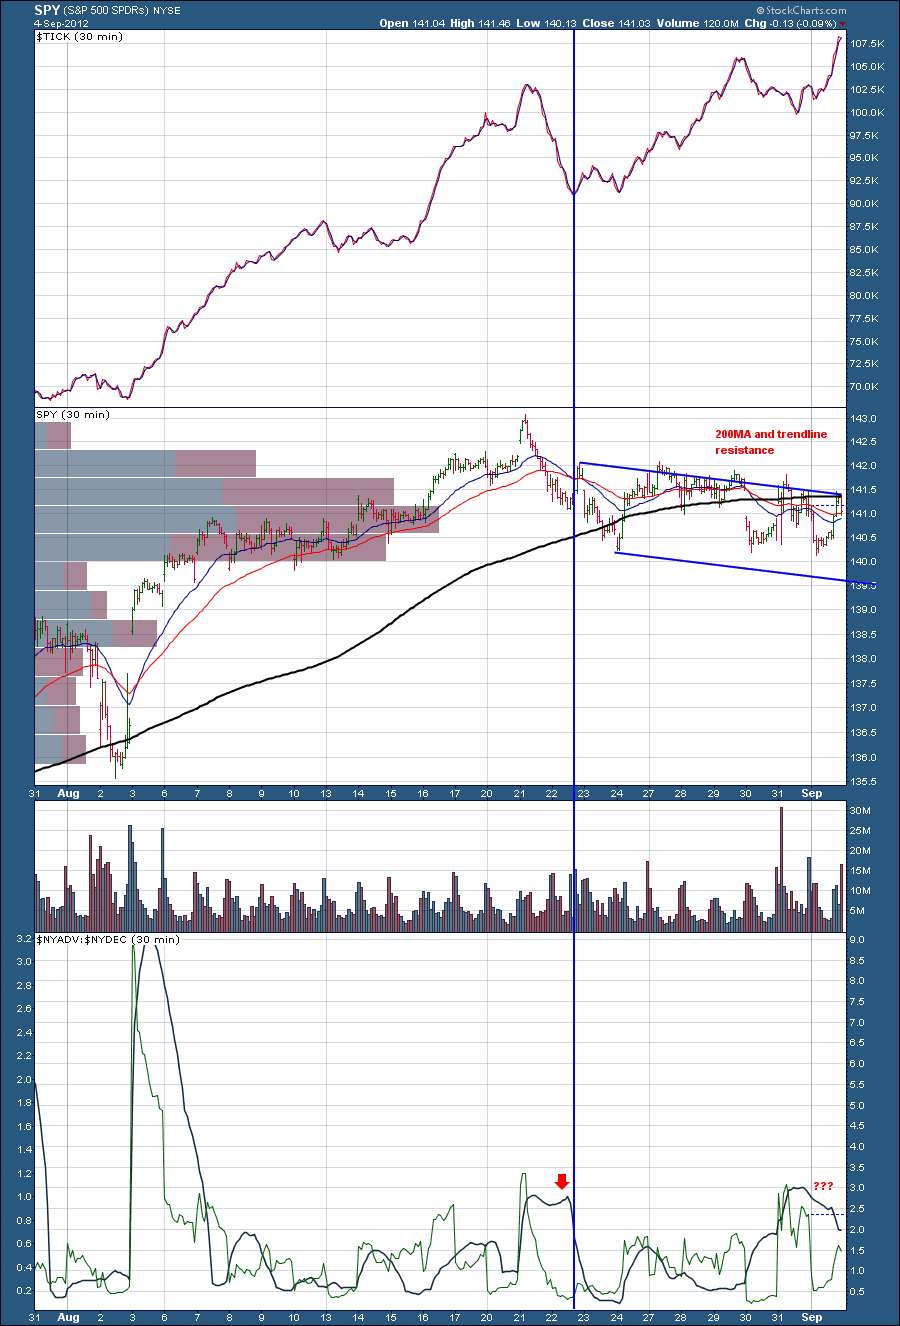
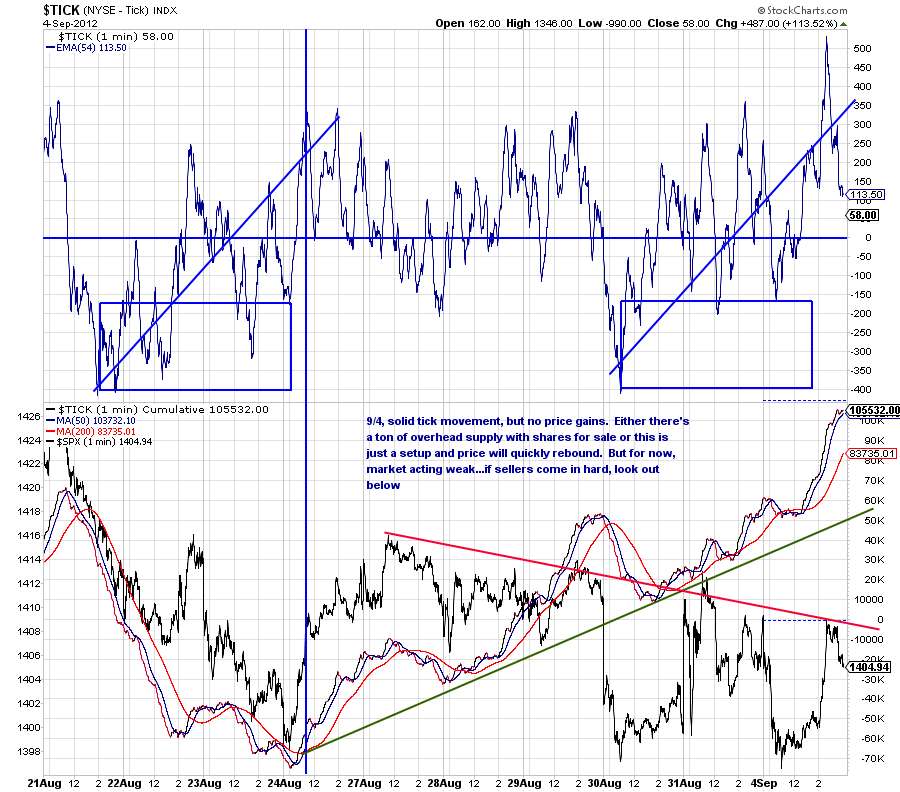
Healthy TICK action, but price not reacting to the upside thus far.  Caution sign.


30-min TICK chart breaking out to new highs, but again, price action weak.  Breadth momentum configuration similar to 8/22.  Dual confluence of resistance factors.  More caution signs.


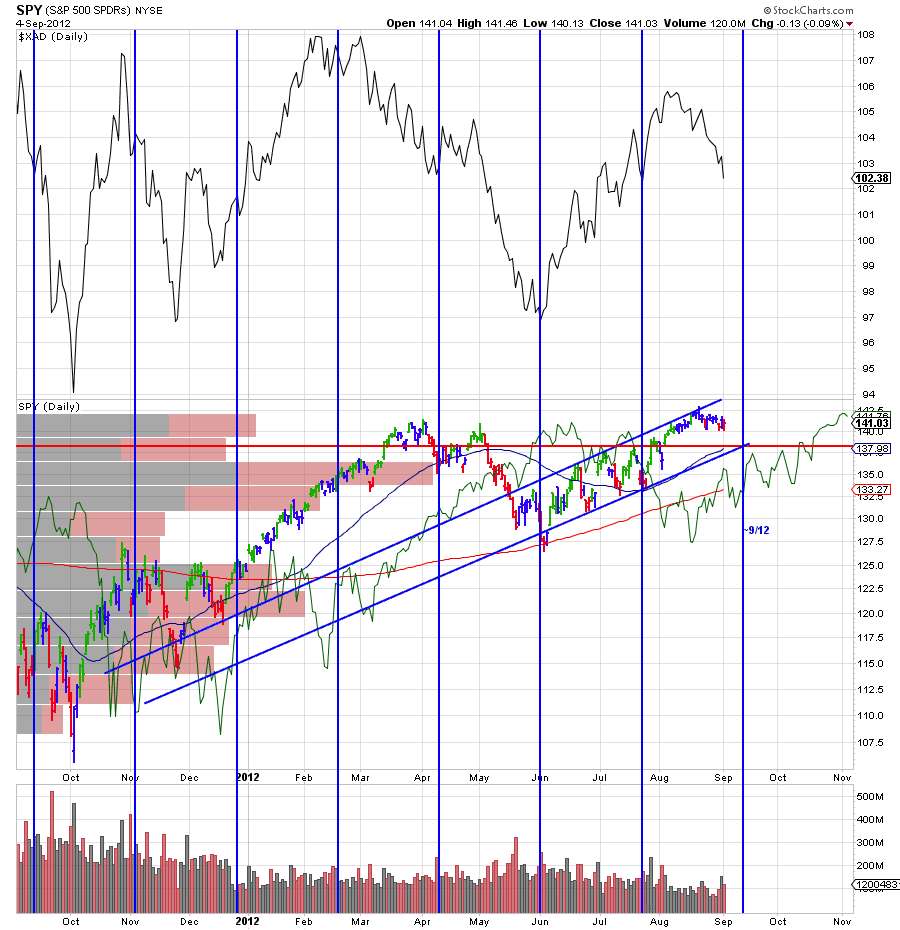
Short-term cycle tracker (vertical blue lines) and SPX correlation with Australian Dollar.  Additional caution.

Some positives today:  financials and small caps outperformed today.  FAS inching closer to that psychological 100 level.  NYSE ratio-adjusted McClellan Oscillator is attempting to regain the 0 line.  For my current option holdings, noticed that implieds came off, which is favorable.  

All factors considered...broad indices have been trading sideways to mildly down in recent days, but generally in a neutral range for weeks now.  Until we see an actual breakout or breakdown, market remains neutral...and appears to be awaiting a catalyst.  Unless you're trading theta/volatility crush, better opportunities lie with individual stocks...e.g. 13 of my top 20 Tier 1 leading stocks closed higher today.

Tuesday, August 28, 2012

Short-term Market Musings

Wednesday SPY has been "opposite" day 8 of the last 9 weeks.  Basically, fading the opening gap and selling gap ups OR buying gap downs at the opening print has been a winner 8 of the last 9 Wednesdays.  Amazingly, 7 of the last 9, the SPY closed within +/- 0.22 of the prior day's close; the other 2 days closed up 1.19 and 1.01.  So another choppy flattish day tomorrow certainly would not surprise given the current market conditions...a big move would.

Note:  I'm using data from Stockcharts.com to compile the info above.

Finally, per the chart below, intraday action (i.e. buying the open and selling the close) has been trending higher since mid April, and the cumulative total since early October 2011 is now just above the 0 line.


Tuesday, August 21, 2012

Short-term Market Musings

Selling pressure finally reappeared after a test of record ALL-TIME highs for SPY.

Visit StockCharts.com to see more great charts.

And the selling, for a change, came with a low TRIN reading...no sign of panic-like selling, so high potential for more distribution.  Keep an eye on the 200period simple-moving average.


Sunday, August 19, 2012

Short-term Market Musings

Fixed interval cycle tracker has been a non-event.  Dashed brown future-line of demarcation on the price  element of the chart hints of a possible strong Monday, which has not been the norm for quite some time.

Visit StockCharts.com to see more great charts.