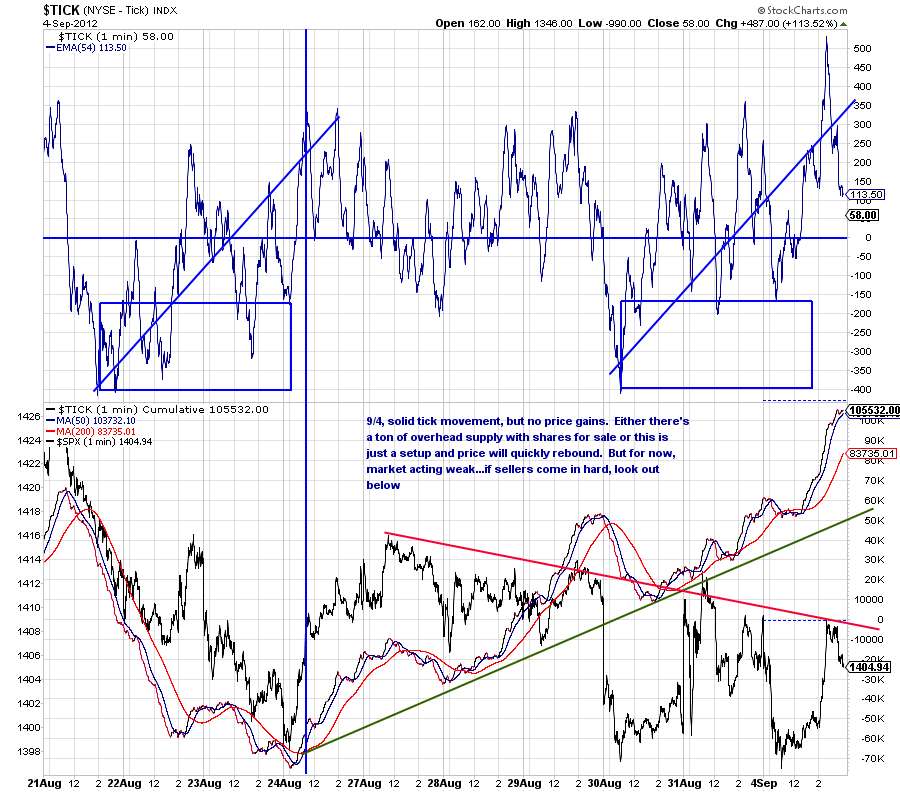
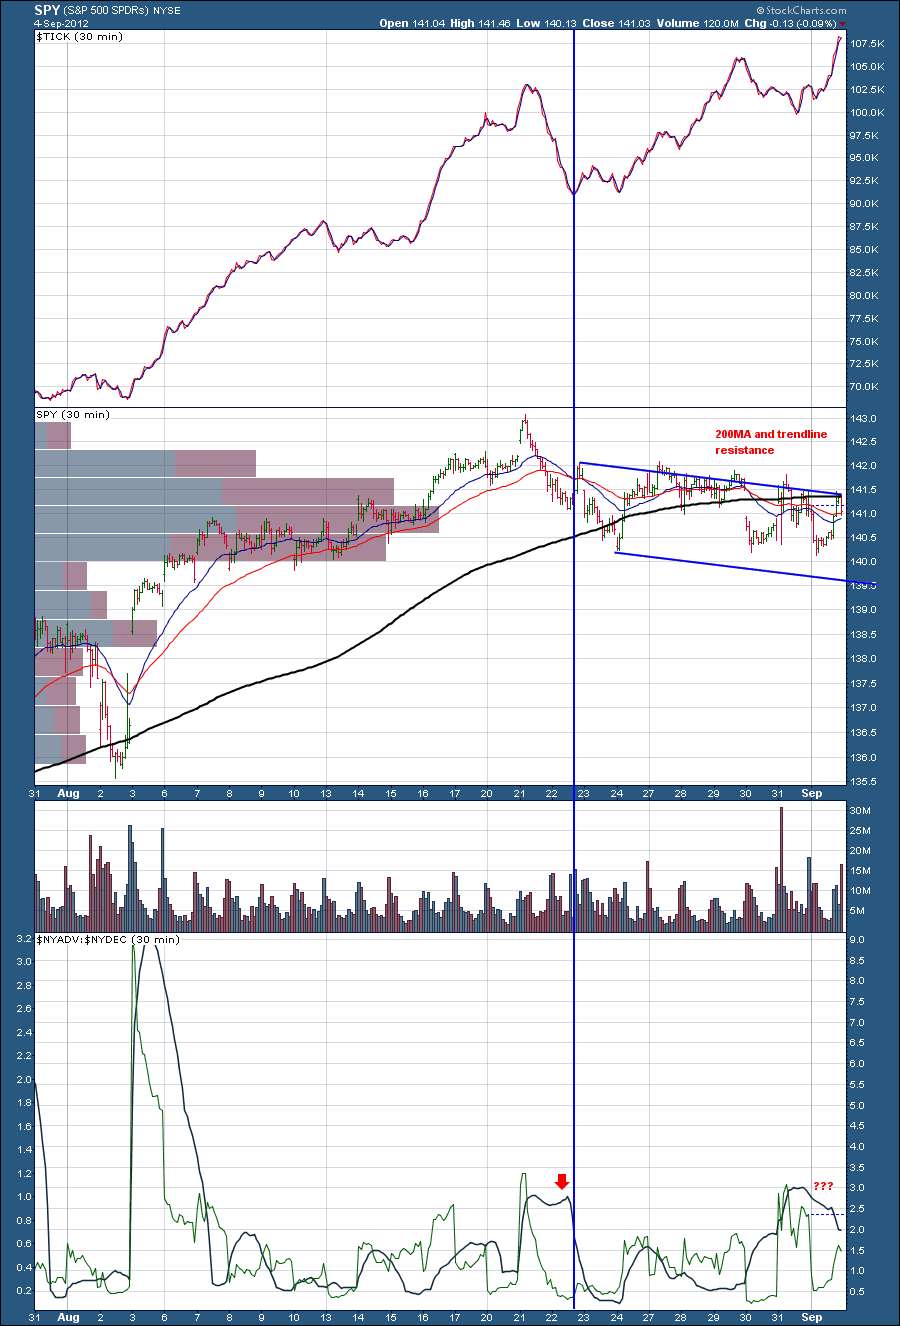
30-min TICK chart breaking out to new highs, but again, price action weak. Breadth momentum configuration similar to 8/22. Dual confluence of resistance factors. More caution signs.
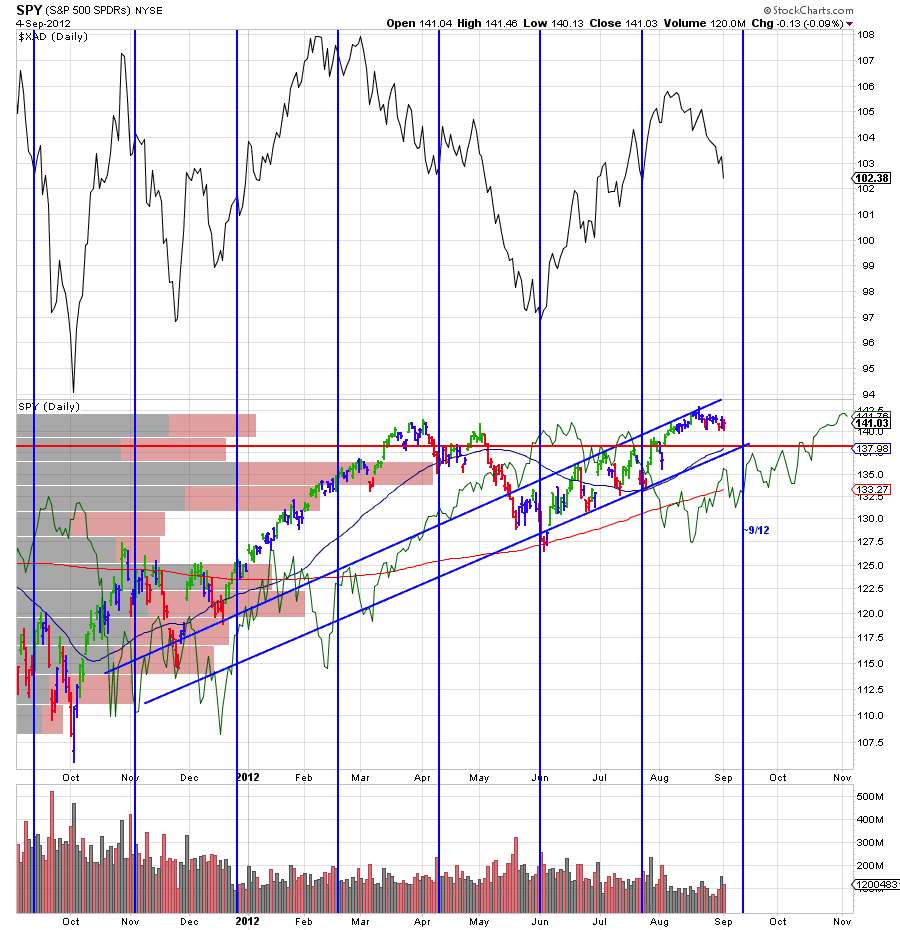
Short-term cycle tracker (vertical blue lines) and SPX correlation with Australian Dollar. Additional caution.
Some positives today: financials and small caps outperformed today. FAS inching closer to that psychological 100 level. NYSE ratio-adjusted McClellan Oscillator is attempting to regain the 0 line. For my current option holdings, noticed that implieds came off, which is favorable.
All factors considered...broad indices have been trading sideways to mildly down in recent days, but generally in a neutral range for weeks now. Until we see an actual breakout or breakdown, market remains neutral...and appears to be awaiting a catalyst. Unless you're trading theta/volatility crush, better opportunities lie with individual stocks...e.g. 13 of my top 20 Tier 1 leading stocks closed higher today.
No comments:
Post a Comment