Friday, June 20, 2014
Thursday, January 24, 2013
Trading Notes 01/24
Wild day in the markets: SPX tagged 1500, RUT closed above 900, and AAPL got crushed. Interesting that the AAPL selloff seemed to trigger buys in AMZN, GOOG, PCLN, all closing up > 1%. Then there were the VIX ETFs: massive squeeze followed by a hard reversal back down to the open. Finally, almost forgot about NFLX...up 42%++.
SPY closed above its opening print for the 11th consecutive day. Not surprising considering how oversold we got during Q4 2012. Plus it doesn't hurt that electronic bid-asks, be it through algos or market makers, are maintaining a very STEALTH bid under this market...driving cumulative TICK higher and keeping selling pressure muted...no one has to hit bids, just let sell orders taken out by the rising electronic bid-asks.
Only thing of interest I noticed tonight is in the futures chart below. Basically, all of the recent pullbacks have been preceded by a spike in OBV for the e-mini S&P futures. I've marked each of the last 3 with a white line and made duplicates to compare today's selloff against the prior to gauge time and duration. 2 of the prior 3 took longer to complete timewise, but magnitude of the current pullback has already exceed each of the last 3. Tonight, we are hugging trendline support (not on the chart), coinciding with the 38.2% fib retracement level of the 1/18 low to today's high and also right at a heavy volume node. Should we actually break the 149 weekly floor on SPY, 1484 (50% retracement) and 1480ish come in play.

Given the stealth nature of the market bid, bias will remain to write OTM put spreads below key support levels. Yes, signs are building for a top, but as they're usually rounded, it will likely be weeks (if ever...tongue-in-cheek) that we see a material selloff (>3% is material these days in the algo-driven market).
Sunday, October 14, 2012
Big Picture Market Context
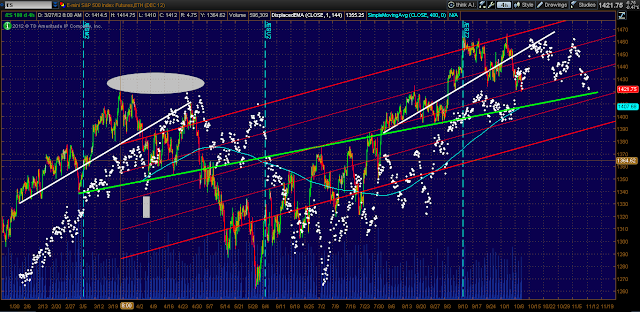
Just wanted to put up a quick post where I think we stand regarding the cyclical picture. Several cycle guys I watch all believe we're near commencement of the final 20 week cycle of a larger degree 80 week cycle, which has a target bottoming TIME window sometime near the end of January 2013. I think there's potential for it to extend into mid-2013, but I'll save that for next year. Right now, I'm in agreement with the others, at least for the near term, and this post illustrates why.
Takeaways from the chart below:
Takeaways from the chart below:
- We are testing the dotted white FLD (future line of demarcation)...1st time since April of this year, which I've highlighted with an Oval above the price action. A meaningful break will confirm that the trend has turned, and at current levels, using Hurst projection methods, 1375 is our preliminary target...over the course of TIME. If this is in fact the final phase of a larger degree 80-week cycle, I would expect that downside target to be overshot. Again, we're talking about the next 20 weeks or so, so there's a lot of time ahead of us.
- I also marked a rectangle on the chart...which is our analog reference analog point for the current cycle. You'll see in April (right at the start of Q1 earnings season), we found support at the 400 period moving average. Currently, that moving average resides at ~1408 on the futures, about 1415 cash equivalent. Coincidental or not, that's also where the delineating bull/bear trendline (lime green) starting in March of this year comes in. If/when we test that trendline, I'm expecting some sort of bounce. Since this is the possibly the last phase of a larger cyclical downturn, my thinking is that the bounce will not be as strong as the early April to late April rally...i.e. larger degree cycle in its late stages could be the most bearish wave pricewise.
- Finally, I've drawn 2 white trendlines (duplicates of one another) to compare the April top to the current. Time-wise, after the current selloff ends, I'm guessing some sideways / sideways-up price action into November...perhaps the powers that be hold it up into the Thanksgiving timeframe. But currently and always subject to change, Dec/Jan not looking like favorable periods to be in the market.
Tuesday, September 25, 2012
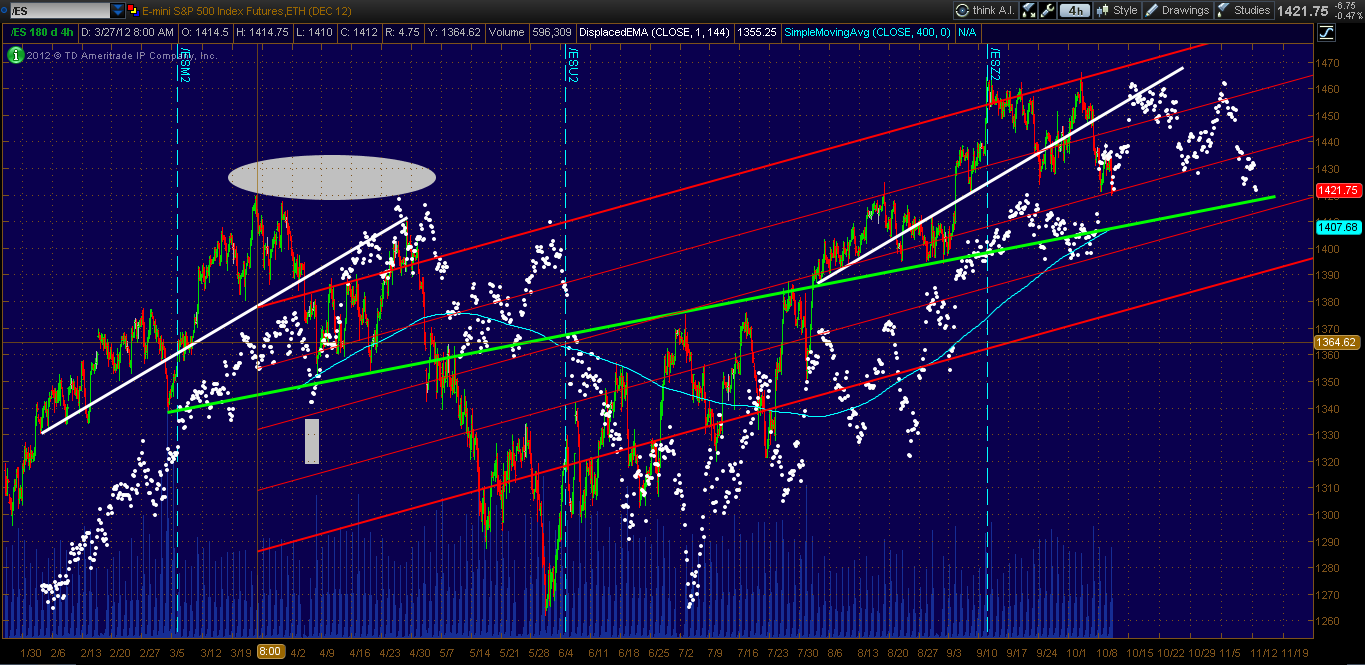
Short-term Market Musings 09/25
Dynamic regression support circa 1425-30 on the e-mini futures (4-hour chart basis), resistance 1447. Elder Impulse system went to sell today. NY McClellan Oscillator -36. TRIN closed at a whopping 3.1, so distribution was lopsided. 200SMA on the hourly chart is 142.71.
Wednesday trading stats...amazingly consistent the last dozen weeks.
Since and including 6/27 (week after the last quarterly expiration), SPY has closed up 10 out of the last 12 Wednesdays, but only by an average of 0.26...bulk of the cumulative gains of 3.06 came on 3 of those 10 days. The 2 down days both closed down a tiny -0.12. So basically it's been a "stuck up" day with strong underlying bid to the market...setting up for weekly expiration I suppose.
8 of the 12 days gapped up, but only 5 (42%) closed above the opening print. Amazingly, 10 out of the last 11 Wednesdays, the opening gap was faded and reversed during regular trading hours. In other words, if we gapped up, intraday action would close below the open. Conversely, if we gapped down, SPY closed above its opening print. The only day the gap wasn't faded...we closed right at the opening print, so net intraday gains was a big fat 0. In general, Wednesday trading has seen very low volatility the last 9 weeks with an average gain of 0.07...we'll see if today was a catalyst to change that.
Might be wishful thinking, but I'm hoping for another ~1.5% downside sub 1420 on the futures...lopsided TRIN only read I see right now that might prevent that.
Tuesday, September 4, 2012
Short-term Market Musings 09/03
Healthy TICK action, but price not reacting to the upside thus far. Caution sign.
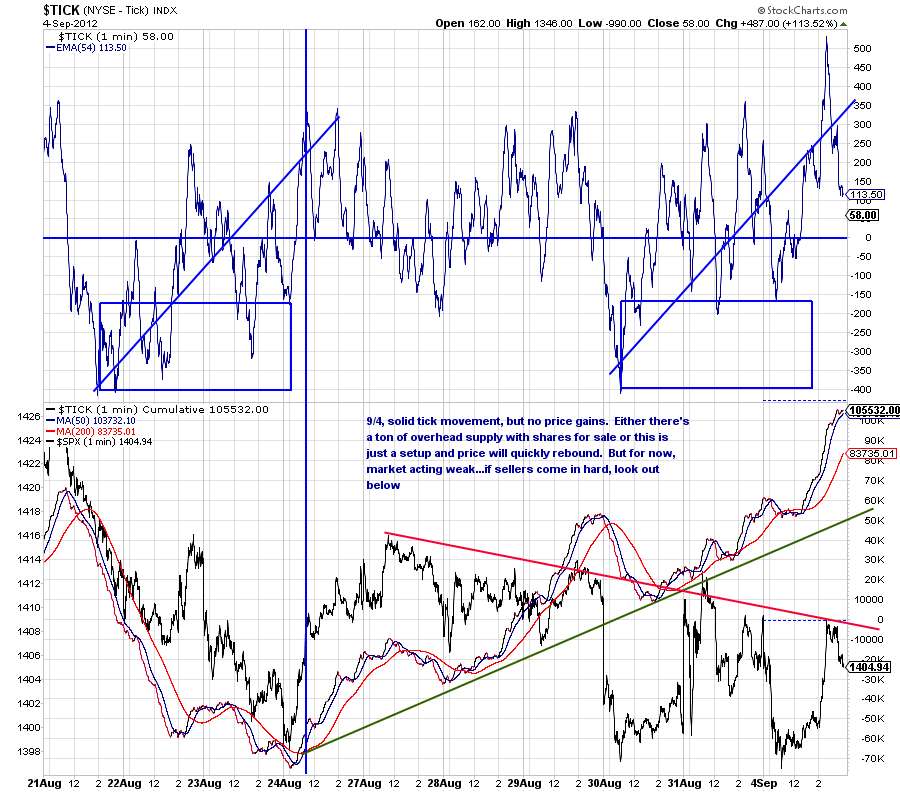
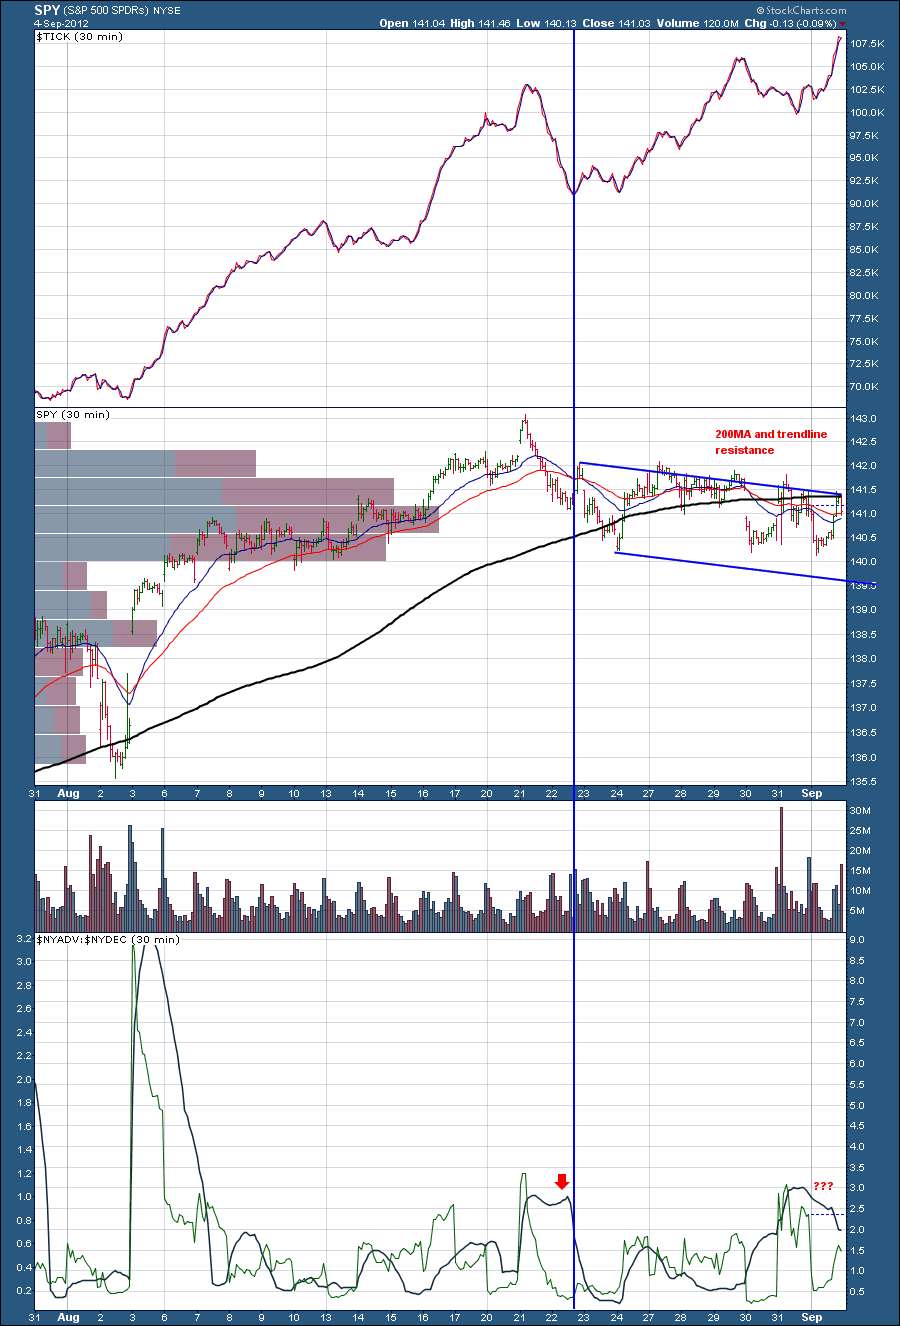
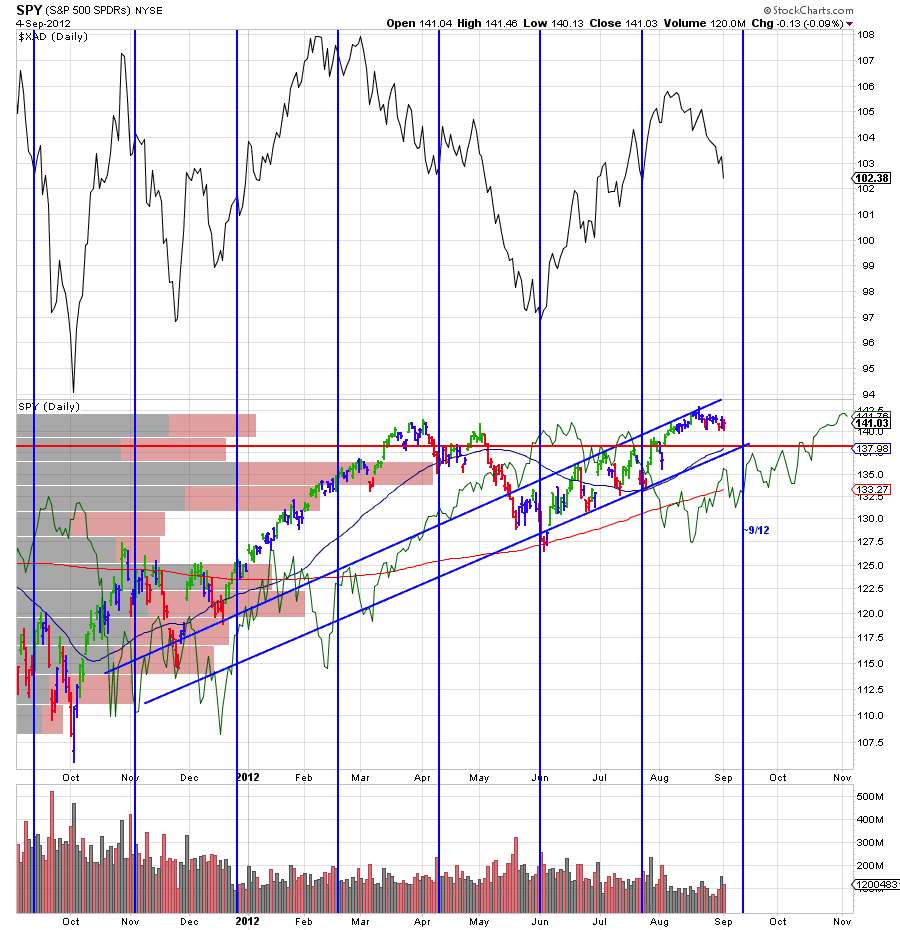
30-min TICK chart breaking out to new highs, but again, price action weak. Breadth momentum configuration similar to 8/22. Dual confluence of resistance factors. More caution signs.
Short-term cycle tracker (vertical blue lines) and SPX correlation with Australian Dollar. Additional caution.
Some positives today: financials and small caps outperformed today. FAS inching closer to that psychological 100 level. NYSE ratio-adjusted McClellan Oscillator is attempting to regain the 0 line. For my current option holdings, noticed that implieds came off, which is favorable.
All factors considered...broad indices have been trading sideways to mildly down in recent days, but generally in a neutral range for weeks now. Until we see an actual breakout or breakdown, market remains neutral...and appears to be awaiting a catalyst. Unless you're trading theta/volatility crush, better opportunities lie with individual stocks...e.g. 13 of my top 20 Tier 1 leading stocks closed higher today.
Monday, September 3, 2012
On the Radar - RKT, CNQR, MDVN and WHR
From the Leading Stocks post earlier today, here's a listing of the top 20:

Some notes on the columns.
In focus are the 4 stocks offering an Expectancy Yield > 4.0%. As an example, let's take a closer look at CNQR.
Concur Technologies, Inc. (Concur) is a global provider of on-demand Employee Spend Management solutions. The Company’s software solutions enable organizations to control costs by automating the processes used to manage employee spending. Its solutions unite online travel procurement with automated expense reporting and optimize the process of collecting, submitting, tracking and paying supplier invoices and check requests. Its provides its customers with visibility into their employee spending, which helps to analyze trends, influence budget decisions, and monitor and enforce compliance with corporate policies and external regulations, including the Sarbanes-Oxley Act. It sells its solutions and services on a subscription basis and delivers them on-demand.
BRIEF: For the nine months ended 30 June 2012, Concur Technologies, Inc. revenues increased 27% to $321.9M. Net income decreased 64% to $1.2M. Revenues reflect United States segment increase of 24% to $272.8M, Europe segment increase of 50% to $37.1M. Net income was offset by Sales and marketing increase of 24% to $127.4M (expense), Amortization of intangible assets increase from $6.9M to $13.8M (expense).
Daily chart:

Hourly chart:

On the hourly chart, trading action is near the lower regression trendline. A break below and $71 is next support from the daily center regression line. Next support comes in circa $67 and then $63 below that. On the upside, need to meaningfully break above $73, bringing $75 into play. YTD, the worst 3-week drawdown (there are 3 weeks until September expiration) on a close-to-close basis has been (9.16%), which came back in the March-April timeframe. From Friday's close price of $72.4, $65.00 at September expiration would represent a loss of 10.22%.

Some notes on the columns.
- Margin is $ requirement for each naked put contract written.
- Premium is the $ received for each naked put contract written.
- Yield = Premium / Margin requirement.
- Probability OTM is the probability the option expires out-of-the-money.
- Expectancy Yield is simply Yield * Probability OTM.
In focus are the 4 stocks offering an Expectancy Yield > 4.0%. As an example, let's take a closer look at CNQR.
Concur Technologies, Inc. (Concur) is a global provider of on-demand Employee Spend Management solutions. The Company’s software solutions enable organizations to control costs by automating the processes used to manage employee spending. Its solutions unite online travel procurement with automated expense reporting and optimize the process of collecting, submitting, tracking and paying supplier invoices and check requests. Its provides its customers with visibility into their employee spending, which helps to analyze trends, influence budget decisions, and monitor and enforce compliance with corporate policies and external regulations, including the Sarbanes-Oxley Act. It sells its solutions and services on a subscription basis and delivers them on-demand.
BRIEF: For the nine months ended 30 June 2012, Concur Technologies, Inc. revenues increased 27% to $321.9M. Net income decreased 64% to $1.2M. Revenues reflect United States segment increase of 24% to $272.8M, Europe segment increase of 50% to $37.1M. Net income was offset by Sales and marketing increase of 24% to $127.4M (expense), Amortization of intangible assets increase from $6.9M to $13.8M (expense).
Daily chart:

Hourly chart:

On the hourly chart, trading action is near the lower regression trendline. A break below and $71 is next support from the daily center regression line. Next support comes in circa $67 and then $63 below that. On the upside, need to meaningfully break above $73, bringing $75 into play. YTD, the worst 3-week drawdown (there are 3 weeks until September expiration) on a close-to-close basis has been (9.16%), which came back in the March-April timeframe. From Friday's close price of $72.4, $65.00 at September expiration would represent a loss of 10.22%.
Leading Stocks Watchlist 08/31
I use a rank system to identify leading stocks using volatility and return metrics. From my current universe of 125 stocks, I've decided to break the list down into 4 Tiers with Tier 1 including stocks with the highest rank, Tier 4 the lowest.
For charts of the 4 different Tiers, click on the links below:
Tier 1 Stocks (highest ranked)
Tier 2
Tier 3
Tier 4 (lowest ranked)
For charts of the 4 different Tiers, click on the links below:
Tier 1 Stocks (highest ranked)
Tier 2
Tier 3
Tier 4 (lowest ranked)
Subscribe to:
Posts (Atom)